Gross revenue is the number everyone quotes and the one that hides the most. A store can grow sales while margins erode, stock piles up, and loyal customers quietly leave. These five KPIs cut through that — and every one of them should be a live figure, not a month-end guess.
1. Gross margin (not just revenue)
Revenue is vanity; margin is survival. Track gross margin by category and by product, because a "best seller" that carries thin margin can be worth less than a slower line that keeps more of every sale. Watch the trend: a falling margin on rising revenue is the classic sign of discounting your way to nowhere.
2. Sell-through rate
Of the stock you bought, how much did you actually sell in a period? Low sell-through means cash frozen on shelves and markdowns coming. High sell-through on a line is a signal to reorder before you stock out. This is the single best early-warning metric for buying decisions.
3. Inventory turnover
How many times you sold and replaced your average inventory over a period. Higher turnover means your cash is working, not sitting. Compare it across categories — slow-turning stock ties up the capital that fast-turning lines could be multiplying.
4. Average transaction value (ATV)
Total sales divided by number of transactions. It tells you whether merchandising, bundling, and upsells are working. Lifting ATV is almost always cheaper than acquiring new footfall, and small gains compound across every basket.
5. Customer retention / repeat rate
The share of customers who come back. Acquiring a new customer costs far more than keeping one, so a rising repeat rate is often the healthiest signal a store can show. If retention is falling while acquisition holds up, you have a product or experience problem, not a marketing one.
Making the numbers actually usable
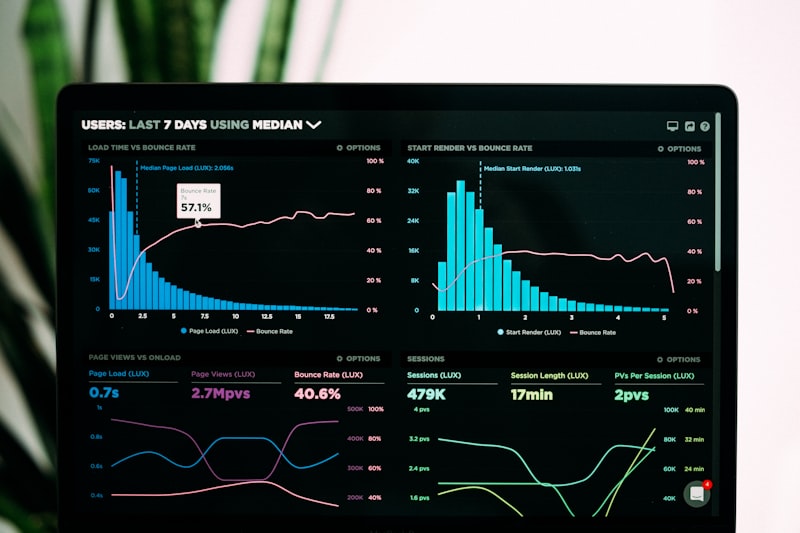
A KPI you calculate once a month in a spreadsheet is a history lesson, not a decision tool. The point is to see them live, segmented, and side by side — margin next to turnover, ATV next to retention — so a dip in one explains a move in another. When your POS, inventory, and customer data share one system, that dashboard builds itself instead of being assembled by hand.
The takeaway
Stop steering by revenue alone. Track margin, sell-through, turnover, ATV, and retention together, keep them current, and you will catch the problems that a growing top line is hiding.